MathLog
MathLog
函数返回一组自然对数。
double  MathLog(
   double  val      // 取对数的数值
   );
参量
- val
[in] 可以找到对数值。
返回值
如果成功出现自然对数val,如果val是负的,函数返回NaN(未定值)。如果val等于0,函数返回INF(无限)。
注释
取代MathLog() 可以使用 log()。
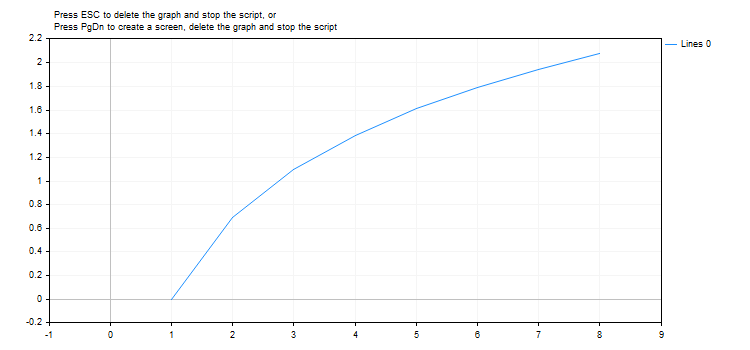
示例:
#define GRAPH_WIDTH  750
#define GRAPH_HEIGHT 350

#include <Graphics\Graphic.mqh>

CGraphic ExtGraph;
//+------------------------------------------------------------------+
//| 脚本程序起始函数                                                   |
//+------------------------------------------------------------------+
void OnStart()
  {
//--- 获取从0到8的9个值,步长为1
   vector X(9,VectorArange);
   Print("vector X = \n",X);
//--- 计算X向量每个值的对数
   X=MathLog(X);
   Print("MathLog(X) = \n",X);

//--- 将计算值从向量传输到数组
   double y_array[];
   X.Swap(y_array);

//--- 绘制计算出的向量值的图形
   CurvePlot(y_array,clrDodgerBlue);

//--- 等待按下Escape或PgDn键删除图形(截取屏幕截图)并退出
   while(!IsStopped())
     {
      if(StopKeyPressed())
         break;
      Sleep(16);
     }

//--- 清除
   ExtGraph.Destroy();
   /*
   result:
   vector X =
   [0,1,2,3,4,5,6,7,8]
   MathLog(X) =
   [-inf,0,0.6931471805599453,1.09861228866811,1.386294361119891,1.6094379124341,1.791759469228055,1.945910149055313,2.079441541679836]
   */
  }
//+------------------------------------------------------------------+
//| Fill a vector with 'value' in 'step' increments                  |
//+------------------------------------------------------------------+
template<typename T>
void VectorArange(vector<T> &vec,T value=0.0,T step=1.0)
  {
   for(ulong i=0; i<vec.Size(); i++,value+=step)
      vec[i]=value;
  }
//+------------------------------------------------------------------+
//| When pressing ESC, return 'true'                                 |
//| When pressing PgDn, take a graph screenshot and return 'true'    |
//| Otherwise, return 'false'                                        |
//+------------------------------------------------------------------+
bool StopKeyPressed()
  {
//--- 如果按下ESC,则返回'true'
   if(TerminalInfoInteger(TERMINAL_KEYSTATE_ESCAPE)!=0)
      return(true);
//--- 果按下PgDn,并且成功抓取图形屏幕截图,则返回'true'
   if(TerminalInfoInteger(TERMINAL_KEYSTATE_PAGEDOWN)!=0 && MakeAndSaveScreenshot(MQLInfoString(MQL_PROGRAM_NAME)+"_Screenshot"))
      return(true);
//--- 返回'false'
   return(false);
  }
//+------------------------------------------------------------------+
//| Create a graph object and draw a curve                           |
//+------------------------------------------------------------------+
void CurvePlot(double &x_array[], double &y_array[], const color colour)
  {
   ExtGraph.Create(ChartID(), "Graphic", 0, 0, 0, GRAPH_WIDTH, GRAPH_HEIGHT);
   ExtGraph.CurveAdd(x_array, y_array, ColorToARGB(colour), CURVE_LINES);
   ExtGraph.IndentUp(30);
   ExtGraph.CurvePlotAll();
   string text1="Press ESC to delete the graph and stop the script, or";
   string text2="Press PgDn to create a screen, delete the graph and stop the script";
   ExtGraph.TextAdd(54, 9, text1, ColorToARGB(clrBlack));
   ExtGraph.TextAdd(54,21, text2, ColorToARGB(clrBlack));
   ExtGraph.Update();
  }
//+------------------------------------------------------------------+
//| Take a screenshot and save the image to a file                   |
//+------------------------------------------------------------------+
bool MakeAndSaveScreenshot(const string file_name)
  {
   string file_names[];
   ResetLastError();
   int selected=FileSelectDialog("Save Picture", NULL, "All files (*.*)|*.*", FSD_WRITE_FILE, file_names, file_name+".png");
   if(selected<1)
     {
      if(selected<0)
         PrintFormat("%s: FileSelectDialog() function returned error %d", __FUNCTION__, GetLastError());
      return false;
     }

   bool res=false;
   if(ChartSetInteger(0,CHART_SHOW,false))
      res=ChartScreenShot(0, file_names[0], GRAPH_WIDTH, GRAPH_HEIGHT);
   ChartSetInteger(0,CHART_SHOW,true);
   return(res);
  }
结果: