CHistogramChart
CHistogramChart
绘制直方图的类。
描述
在这个类中实施使用绘制直方图的全部方法。它们可以用于设置列宽和配置数据序列。包括使用逐渐填充直方图的方法,使数据更清晰的可视化。
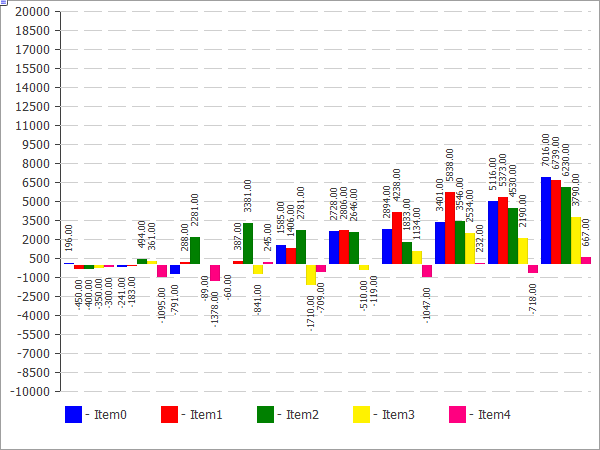
下面提供图形上方的代码。
声明
class CHistogramChart : public CChartCanvas主题
#include <Canvas\Charts\HistogramChart.mqh>继承体系
CHistogramChart
类函数
| 方法 | 动作 |
|---|---|
| Gradient | 设置显示是否使用逐渐填充直方图列的标识。 |
| BarGap | 设置自原点的直方图偏移值。 |
| BarMinSize | 设置直方图的最小列宽。 |
| BarBorder | 设置需要为每个列绘制边框的标识。 |
| Create | 创建图形资源的虚拟方法。 |
| SeriesAdd | 添加新的数据序列。 |
| SeriesInsert | 插入数据序列到图表。 |
| SeriesUpdate | 更新图表上的数据序列。 |
| SeriesDelete | 从图表删除数据序列。 |
| ValueUpdate | 更新指定序列的元素值。 |
| DrawData | 为指定序列绘制直方图的虚拟方法。 |
| DrawBar | 将直方图列绘制为填充矩形。 |
| GradientBrush | 为逐渐填充创建笔刷。 |
方法继承自类 CChartCanvas
: ColorBackground, ColorBackground, ColorBorder, ColorBorder, ColorText, ColorText, ColorGrid, ColorGrid, MaxData, MaxData, MaxDescrLen, MaxDescrLen, AllowedShowFlags, ShowFlags, ShowFlags, IsShowLegend, IsShowScaleLeft, IsShowScaleRight, IsShowScaleTop, IsShowScaleBottom, IsShowGrid, IsShowDescriptors, IsShowPercent, ShowLegend, ShowScaleLeft, ShowScaleRight, ShowScaleTop, ShowScaleBottom, ShowGrid, ShowDescriptors, ShowValue, ShowPercent, LegendAlignment, Accumulative, VScaleMin, VScaleMin, VScaleMax, VScaleMax, NumGrid, NumGrid, VScaleParams, DataOffset, DataOffset, DataTotal, DescriptorUpdate, ColorUpdate
示例
//+------------------------------------------------------------------+
//|                                         HistogramChartSample.mq5 |
//|                   Copyright 2009-2017, MetaQuotes Software Corp. |
//|                                              http://www.mql5.com |
//+------------------------------------------------------------------+
#property copyright   "2009-2017, MetaQuotes Software Corp."
#property link        "http://www.mql5.com"
#property description "Example of using histogram"
//---
#include <Canvas\Charts\HistogramChart.mqh>
//+------------------------------------------------------------------+
//| 输入                                                              |
//+------------------------------------------------------------------+
input bool Accumulative=true;
//+------------------------------------------------------------------+
//| 脚本程序起始函数                                                   |
//+------------------------------------------------------------------+
int OnStart(void)
  {
   int k=100;
   double arr[10];
//--- 创建图表
   CHistogramChart chart;
   if(!chart.CreateBitmapLabel("SampleHistogramChart",10,10,600,450))
     {
      Print("Error creating histogram chart: ",GetLastError());
      return(-1);
     }
   if(Accumulative)
     {
      chart.Accumulative();
      chart.VScaleParams(20*k*10,-10*k*10,20);
     }
   else
      chart.VScaleParams(20*k,-10*k,20);
   chart.ShowValue(true);
   chart.ShowScaleTop(false);
   chart.ShowScaleBottom(false);
   chart.ShowScaleRight(false);
   chart.ShowLegend();
   for(int j=0;j<5;j++)
     {
      for(int i=0;i<10;i++)
        {
         k=-k;
         if(k>0)
            arr[i]=k*(i+10-j);
         else
            arr[i]=k*(i+10-j)/2;
        }
      chart.SeriesAdd(arr,"Item"+IntegerToString(j));
     }
//--- 使用值
   while(!IsStopped())
     {
      int i=rand()%5;
      int j=rand()%10;
      k=rand()%3000-1000;
      chart.ValueUpdate(i,j,k);
      Sleep(200);
     }
//--- 完成
   chart.Destroy();
   return(0);
  }