ArraySetAsSeries
ArraySetAsSeries
设置标记到选定的动态数组对象的函数,其元件如时间序列中一样被索引。
bool  ArraySetAsSeries(
   const void&  array[],    // 通过引用的数组
   bool         flag        // true表示倒序索引
   );
参量
- array[]
[in][out] 设置数字数组
- flag
[in] 数组索引方向
返回值
成功函数返回true,否则 - false.
注释
不能为多维数组或静态数组(数组,方框中的大小在编译步骤已经存在)设置 AS_SERIES 标记。 时间序列中的索引不同于时间序列元件中普通数组,从后往前(从最新的到最原始数据)。
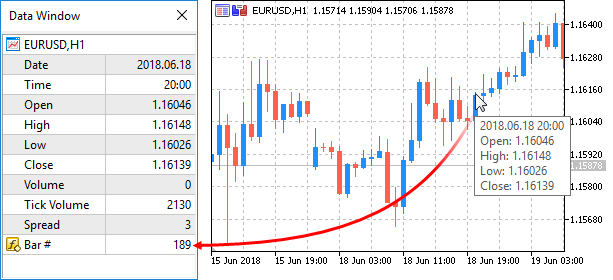
示例:显示柱值的指标
#property indicator_chart_window
#property indicator_buffers 1
#property indicator_plots   1
//---- 图的编号
#property indicator_label1  "Numeration"
#property indicator_type1   DRAW_LINE
#property indicator_color1  CLR_NONE
//--- 指标缓冲区
double         NumerationBuffer[];
//+------------------------------------------------------------------+
//| 自定义指标初始化函数                                                |
//+------------------------------------------------------------------+
int OnInit()
  {
//--- 自定义缓冲区绘图
   SetIndexBuffer(0,NumerationBuffer,INDICATOR_DATA);
//--- 为类似时间序列的缓冲区设置指标
   ArraySetAsSeries(NumerationBuffer,true);
//--- 设置数据窗口中显示的精确度
   IndicatorSetInteger(INDICATOR_DIGITS,0);
//--- 标识符数组名称在数据窗口中如何显示
   PlotIndexSetString(0,PLOT_LABEL,"Bar #");
//---
   return(0);
  }
//+------------------------------------------------------------------+
//| 自定义指标重复函数                                                  |
//+------------------------------------------------------------------+
int OnCalculate(const int rates_total,
                const int prev_calculated,
                const datetime &time[],
                const double &open[],
                const double &high[],
                const double &low[],
                const double &close[],
                const long &tick_volume[],
                const long &volume[],
                const int &spread[])
  {
//---  存储当前打开的零柱时间
   static datetime currentBarTimeOpen=0;
//--- 返回访问数组时间[] - 像时间序列一样
   ArraySetAsSeries(time,true);
//--- 如果零柱时间不同于已经存储的
   if(currentBarTimeOpen!=time[0])
     {
     //--- 从当前图表到图表深度列举所有柱
      for(int i=rates_total-1;i>=0;i--) NumerationBuffer[i]=i;
      currentBarTimeOpen=time[0];
     }
//--- 为下次调用返回prev_calculated值
   return(rates_total);
  }