ValuesFunctionFormat
ValuesFunctionFormat (Get method)
Get the pointer to the function defining the format of displaying values on the axis.
DoubleToStringFunction ValuesFunctionFormat()Return Value
Pointer to the function defining the format of displaying values on the axis.
ValuesFunctionFormat (Set method)
Set the pointer to the function defining the format of displaying values on the axis.
void  ValuesFunctionFormat(
   DoubleToStringFunction  func      // function for converting numerical values into a string
   )
Parameters
- func
[in] Custom function for converting numerical values into a string.
Example:
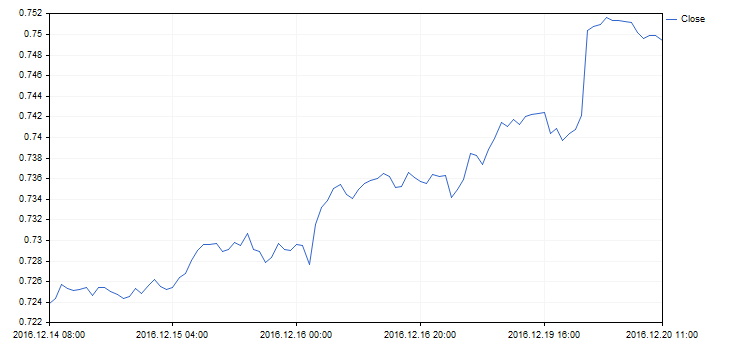
The format of displaying X axis values has been changed using the following code:
//+------------------------------------------------------------------+
//|                                              DateAxisGraphic.mq5 |
//|                        Copyright 2016, MetaQuotes Software Corp. |
//|                                             https://www.mql5.com |
//+------------------------------------------------------------------+
#include <Graphics\Graphic.mqh>
//--- array for store values
double arrX[];
double arrY[];
//+------------------------------------------------------------------+
//| Custom function for create values on X-axis                      |
//+------------------------------------------------------------------+
string TimeFormat(double x,void *cbdata)
  {
   return(TimeToString((datetime)arrX[ArraySize(arrX)-(int)x-1]));
  }
//+------------------------------------------------------------------+
void OnStart()
  {
   MqlRates rates[];
   CopyRates(Symbol(),Period(),0,100,rates);
   ArraySetAsSeries(rates,true);
   int size=ArraySize(rates);
   ArrayResize(arrX,size);
   ArrayResize(arrY,size);
   for(int i=0; i<size;++i)
     {
      arrX[i]=(double)rates[i].time;
      arrY[i]=rates[i].close;
     }
//--- create graphic
   CGraphic graphic;
   if(!graphic.Create(0,"DateAxisGraphic",0,30,30,780,380))
     {
      graphic.Attach(0,"DateAxisGraphic");
     }
//--- create curve
   CCurve *curve=graphic.CurveAdd(arrY,CURVE_LINES);
//--- gets the X-axis
   CAxis *xAxis=graphic.XAxis();
//--- sets the X-axis properties
   xAxis.AutoScale(false);
   xAxis.Type(AXIS_TYPE_CUSTOM);
   xAxis.ValuesFunctionFormat(TimeFormat);
   xAxis.DefaultStep(20.0);
//--- plot
   graphic.CurvePlotAll();
   graphic.Update();
  }
Last updated on