PrecisionRecall
PrecisionRecall
Compute values to construct a precision-recall curve. Similarly to ClassificationScore, this method is applied to the vector of true values.
bool vector::PrecisionRecall(
   const matrix&                 pred_scores,   // matrix containing the probability distribution for each class
   const ENUM_ENUM_AVERAGE_MODE  mode           // averaging mode
   matrix&                       precision,     // calculated precision values for each threshold value
   matrix&                       recall,        // calculated recall values for each threshold value
   matrix&                       thresholds,    // threshold values sorted in descending order
   );
Parameters
- pred_scores
[in] A matrix containing a set of horizontal vectors with probabilities for each class. The number of matrix rows must correspond to the size of the vector of true values.
- mode
[in] Averaging mode from the ENUM_AVERAGE_MODE enumeration. Only AVERAGE_NONE, AVERAGE_BINARY and AVERAGE_MICRO are used.
- precision
[out] A matrix with calculated precision curve values. If no averaging is applied (AVERAGE_NONE), the number of rows in the matrix corresponds to the number of model classes. The number of columns corresponds to the size of the vector of true values (or the number of rows in the probability distribution matrix pred_score). In the case of microaveraging, the number of rows in the matrix corresponds to the total number of threshold values, excluding duplicates.
- recall
[out] A matrix with calculated recall curve values.
- threshold
[out] Threshold matrix obtained by sorting the probability matrix
Note
See notes for the ClassificationScore method.
Example
An example of collecting statistics from the mnist.onnx model (99% accuracy).
| //— data for classification metrics
vectorf y_true(images);
vectorf y_pred(images);
matrixf y_scores(images,10);
//— input-output
matrixf image(28,28);
vectorf result(10);
//— testing
for(int test=0; test<images; test++)
{
image=test_data[test].image;
if(!OnnxRun(model,ONNX_DEFAULT,image,result))
{
Print(“OnnxRun error “,GetLastError());
break;
}
result.Activation(result,AF_SOFTMAX);
//— collect data
y_true[test]=(float)test_data[test].label;
y_pred[test]=(float)result.ArgMax();
y_scores.Row(result,test);
} } |
vectorf accuracy=y_pred.ClassificationMetric(y_true,CLASSIFICATION_ACCURACY);
   PrintFormat("accuracy=%f",accuracy[0]);

accuracy=0.989000
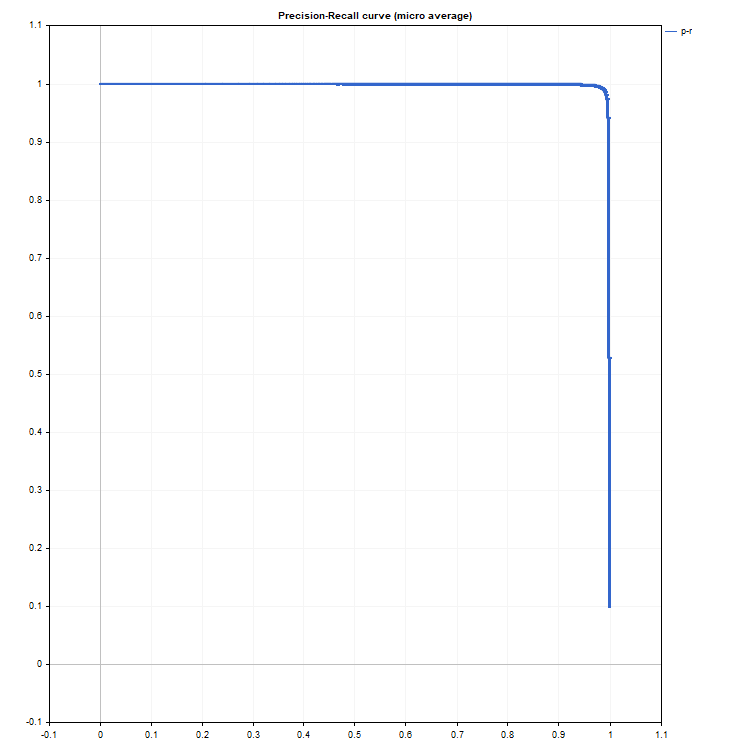
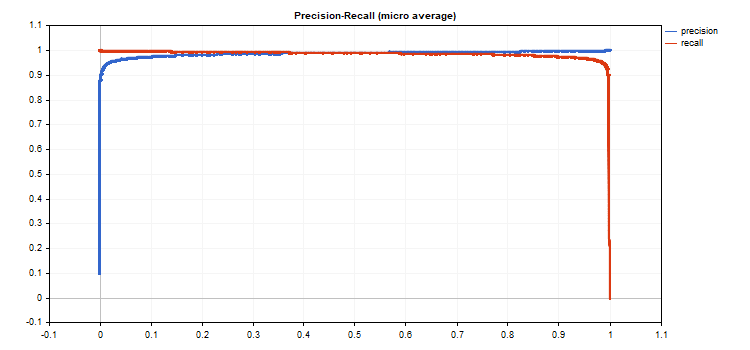
An example of plotting precision-recall graphs, where precision values are plotted on the y-axis and recall values are plotted on the x-axis. Also precision and recall graphs are plotted separately, with threshold values plotted on the x-axis
if(y_true.PrecisionRecall(y_scores,AVERAGE_MICRO,mat_precision,mat_recall,mat_thres))
     {
      double precision[],recall[],thres[];
      ArrayResize(precision,mat_thres.Cols());
      ArrayResize(recall,mat_thres.Cols());
      ArrayResize(thres,mat_thres.Cols());

      for(uint i=0; i<thres.Size(); i++)
        {
         precision[i]=mat_precision[0][i];
         recall[i]=mat_recall[0][i];
         thres[i]=mat_thres[0][i];
        }
      thres[0]=thres[1]+0.001;

      PlotCurve("Precision-Recall curve (micro average)","p-r","",recall,precision);
      Plot2Curves("Precision-Recall (micro average)","precision","recall",thres,precision,recall);
     }
Resulting curves: